How to read your movements report and see what is in each withdrawal
Last updated: September 9, 2026
Every withdrawal you receive in your bank account is the sum of your sales, minus fees and refunds. Your movements report lists all of those movements, one per row. With it you can see what is in any withdrawal on your own, and compare it with your bank statement.
This article explains how to read that file: how much was withdrawn and when, which sales are in each withdrawal, and why you receive less than what you sold.
Download the report and check which version you have
Go to Balance in your dashboard, open the Movements tab and select Export. The file has one row for each movement that changed your balance: approved sales, fees, refunds and withdrawals. The most recent movement is at the top.
Column names are always in English, even if your dashboard is in another language.
There are two versions of the file, depending on how you process payments with us. Look at the column names to know which one you have:
If your file has these columns | You have the |
|---|---|
| Cross-border version |
| Local version |
The difference between them is simple:
Cross-border | Local | |
|---|---|---|
Rows per sale | One | Several: one for the sale and one for each fee |
Where the fees are | All together in | Each fee in its own row |
Amount that changes your balance |
|
|
Currency of the sale | Can be different from your balance ( | Same as your balance |
How much was withdrawn: the balance rule
The running_balance column shows how much money you had right after each movement. Since the newest movement is at the top, the row below a withdrawal is the movement that happened just before it. That gives you a rule that works for both versions of the file:
Withdrawal amount = running_balance of the row below − running_balance of the withdrawal row
You only need to subtract two numbers. In a spreadsheet, that is a subtraction between two cells.
Cross-border example, in USD:
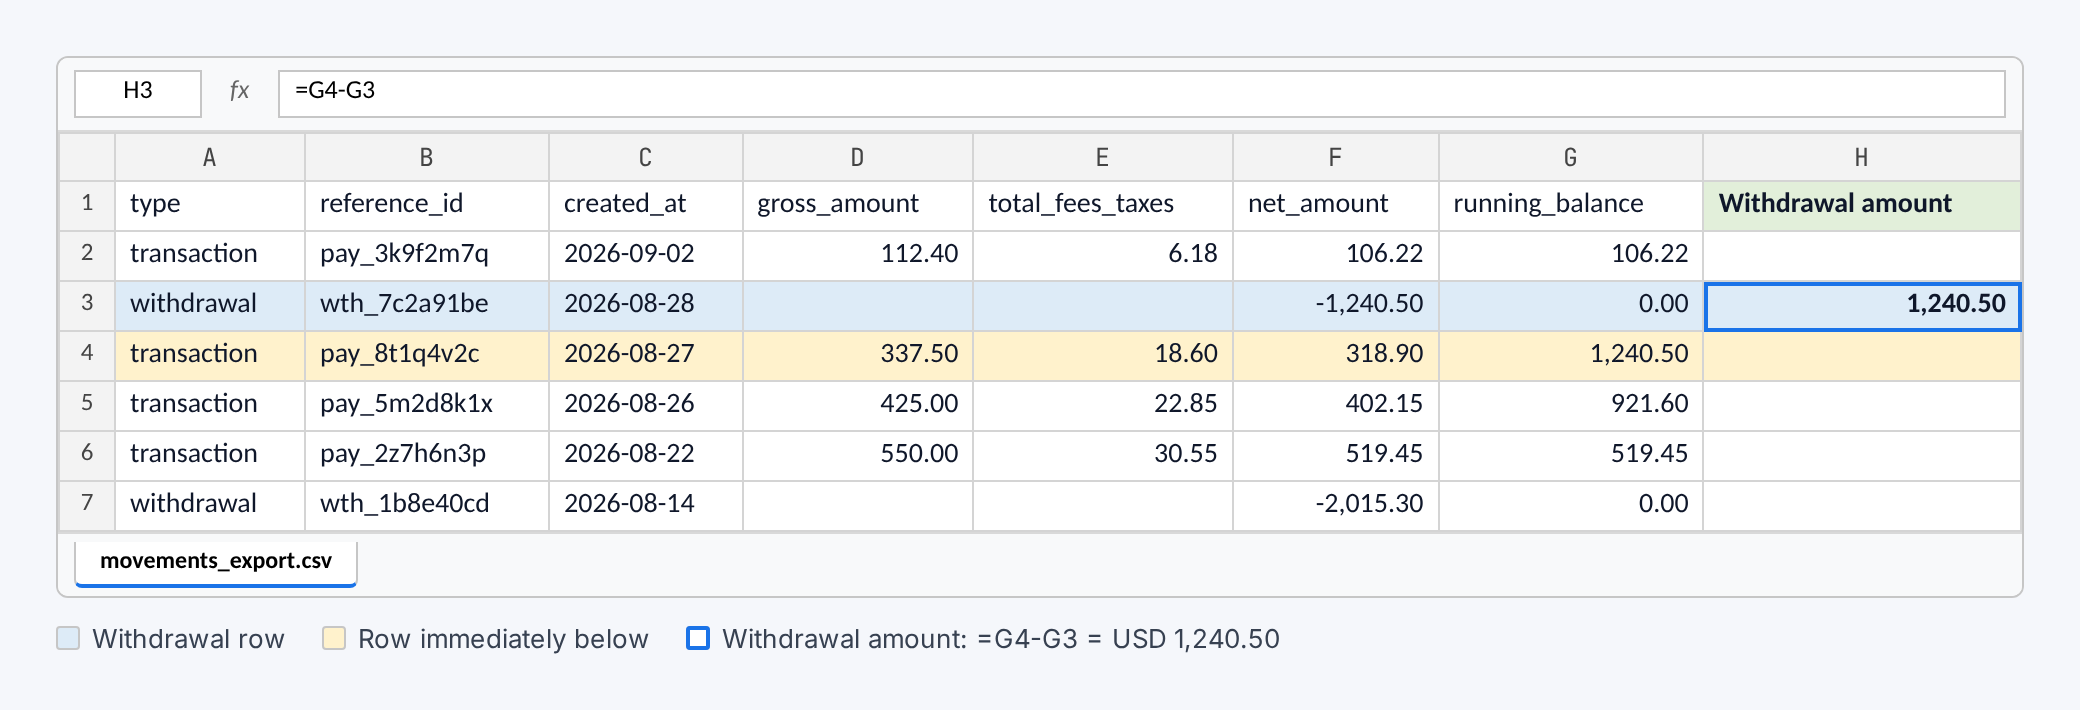
The withdrawal of August 28 is 1,240.50 − 0.00 = USD 1,240.50. In cross-border accounts the withdrawal usually leaves the balance at zero, so the running_balance of the row below is already the amount of the withdrawal.
Local example, in ARS:
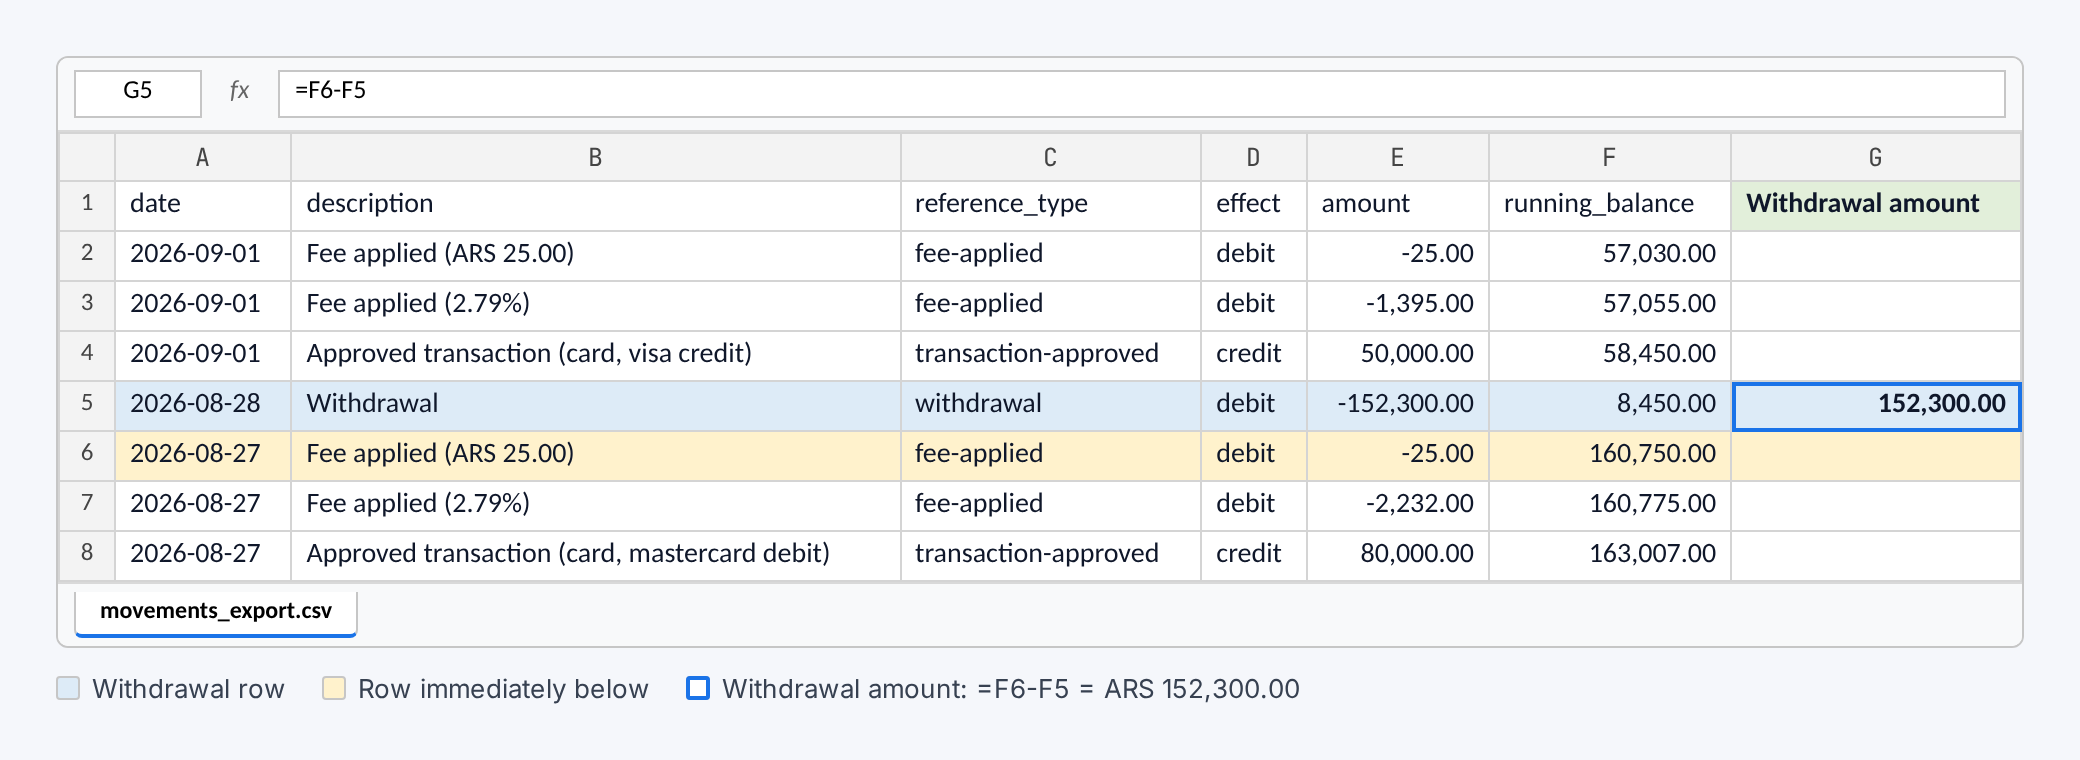
The withdrawal of August 28 is 160,750.00 − 8,450.00 = ARS 152,300.00. It is the same number you see in the amount column of the withdrawal row.
Withdrawals made from the Balance section start with wth_ and match to the cent. If your account has movements from before May 2026, withdrawals that start with wdl_ were loaded during the migration to this section and can be off by a few cents.
Which sales are in each withdrawal
Once you know the amount, you can see which movements are in it.
Cross-border: the withdrawal is made up of all the transaction rows between that withdrawal and the previous one. If you add their net_amount, you get the withdrawal amount. In the example above: 318.90 + 402.15 + 519.45 = 1,240.50.
Local: the withdrawal is made up of all the rows between that withdrawal and the previous one: sales, fees and refunds. If you add their amount, you get the withdrawal amount. Recent movements also have a withdrawal_id column that tells you directly which withdrawal each row belongs to. If that column is empty, that movement has not been withdrawn yet.
Why you receive less than what you sold
Each sale enters your balance with its fees and taxes already taken out. How that looks in the file depends on your version.
Cross-border: each sale is one row, and the numbers are related like this:
gross_amount = net_amount + total_fees_taxes
total_fees_taxes is the total cost of that sale. The columns processing_fee, fx_fee, financing_fee, refund_fee, chargeback_fee and taxes show you what that total is made of.
If your customer paid in their own currency, three more columns show the conversion:
source_amountandsource_currency: what your customer actually paid, in their currency.exchange_rate: the exchange rate we applied.gross_amount: the result of that conversion, in the currency of your balance.
Local: each sale has one transaction-approved row with effect = credit, and one or more fee-applied rows with effect = debit. All of them share the same payment_id. What you keep from that sale is the sale minus its fees. In the example above, the sale of ARS 50,000.00 has two fees, 1,395.00 and 25.00, so you keep ARS 48,580.00. Refunds appear as transaction-refunded rows, also with effect = debit.
The numbers in this article are examples. The fees that apply to you are the ones agreed for your account.
The three dates of a sale
Each sale has three dates. Knowing them explains why a sale from one month can be part of a withdrawal from the next month:
Sale date (
sale_datein cross-border,datein local): the day your customer paid.Estimated accreditation date (
estimated_available_onin cross-border,accreditation_datein local): the day that money becomes available to withdraw. By default it is 15 calendar days after the sale, and 30 days for card payments in Brazil.Withdrawal date (
created_atof the withdrawal row in cross-border,withdrawal_datein local): the day the money was sent to your bank account.
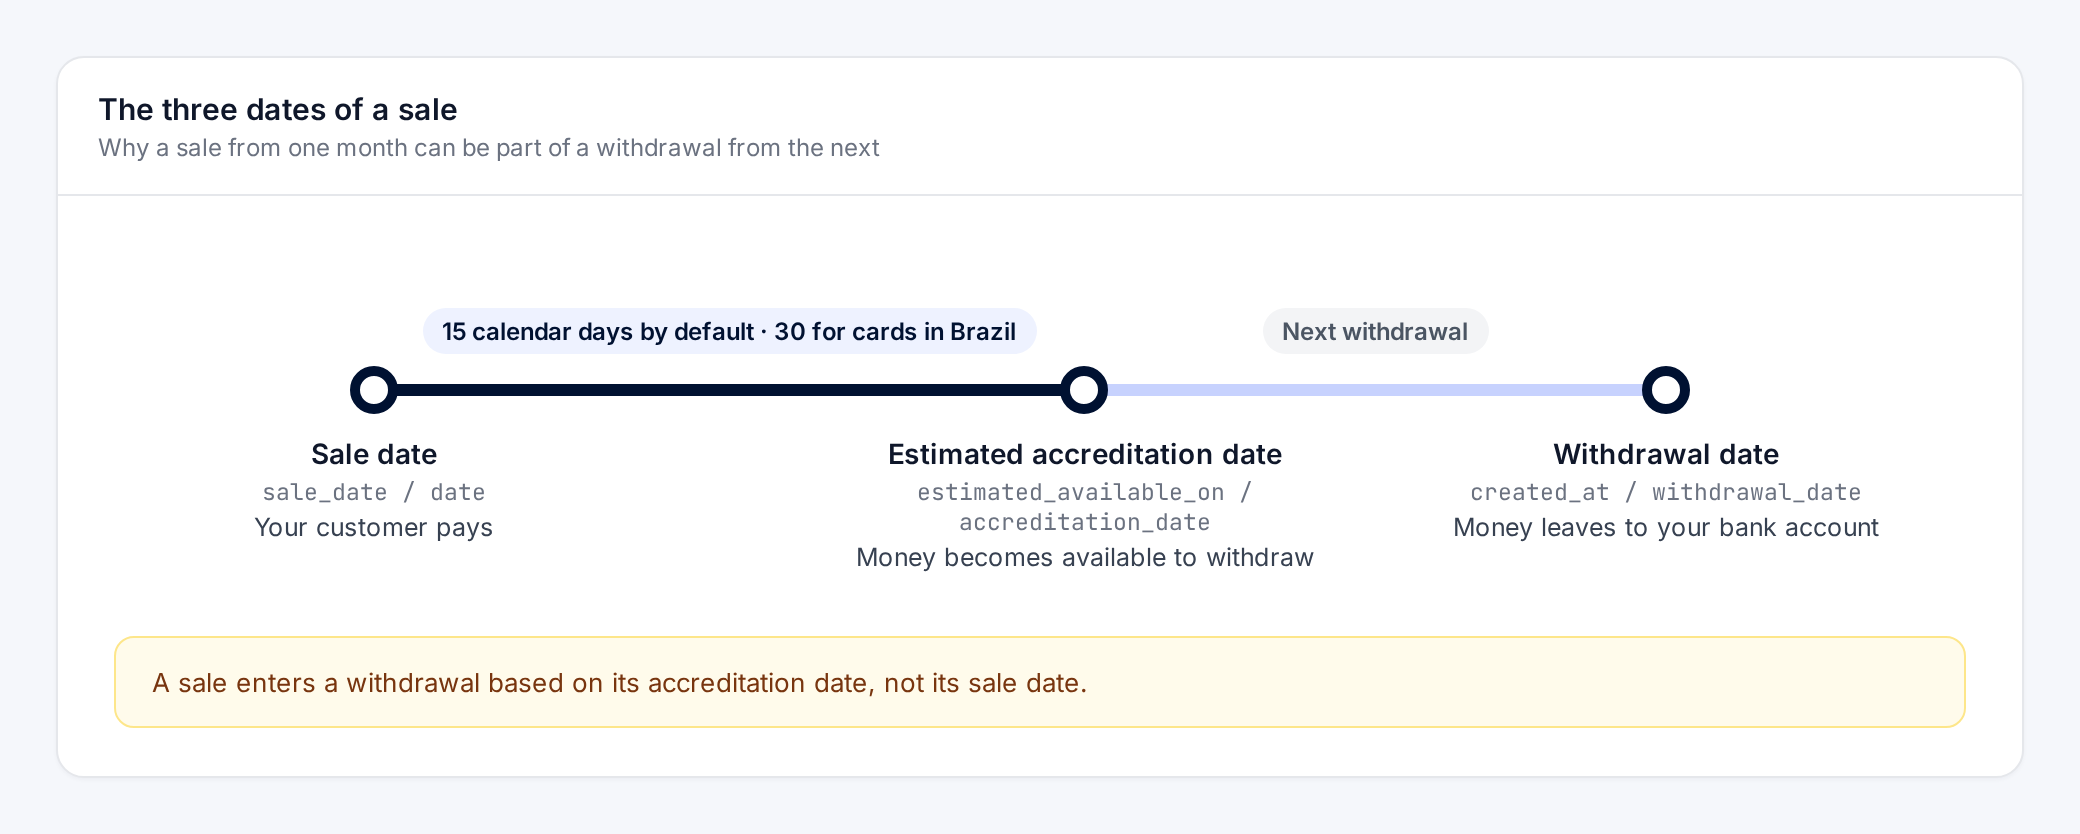
A sale is included in a withdrawal according to its accreditation date, not its sale date.
Shortcut: let an AI tool do it for you
You can paste the file into an AI tool and get the full breakdown in seconds. The prompts below use the balance rule, so the result is reliable.
Before uploading the file to an external tool, delete the buyer_name and buyer_email columns. They contain your customers' personal data, and the breakdown works without them.
Prompt for the cross-border version:
You are an accounting reconciliation assistant. I will give you a CSV of movements
from my payments account. It uses semicolon as the separator and comma as the decimal mark.
Columns: type (withdrawal or transaction), reference_id, payment_id, net_amount
(what adds to or subtracts from the balance), gross_amount (gross sale), total_fees_taxes
(fees and taxes), source_amount and source_currency (what the customer paid in their
currency), exchange_rate, sale_date, estimated_available_on, running_balance
(balance after each movement). The file is ordered from most recent to oldest.
I need you to:
1. List each withdrawal (type = withdrawal) with its date and amount.
2. For each withdrawal, identify the movements that make it up: all the
   type = transaction rows between that withdrawal and the previous one.
3. Verify that the sum of net_amount of those movements equals the withdrawal
   amount, and flag any that does not match.
4. For each withdrawal, show me the total gross sales, the total fees and taxes,
   and the net amount credited.
5. Build a final table with: withdrawal date, amount, number of operations,
   gross, fees and net.
Do not make up data. If a row has empty fields, point it out.
Prompt for the local version:
You are an accounting reconciliation assistant. I will give you a CSV of movements
from my payments account. It uses semicolon as the separator and comma as the decimal mark.
Columns: date, description, reference_type (withdrawal, transaction-approved,
transaction-refunded or fee-applied), effect (credit adds, debit subtracts), amount
(already signed), payment_method, card_brand, installments, payment_id,
accreditation_date, withdrawal_id, withdrawal_date, running_balance (balance
after each movement). The file is ordered from most recent to oldest. Each sale
generates several rows: one for the sale and one for each fee.
I need you to:
1. List each withdrawal (reference_type = withdrawal) with its date and amount.
2. Calculate the amount of each withdrawal as the difference between the running_balance
   of the row immediately below and the running_balance of the withdrawal row,
   and confirm that it matches the reported amount.
3. Group the fees by payment_id, so I can see what each sale cost.
4. Tell me the total sold, the total fees, the total refunds and the net for the period.
5. Build a table with: date, payment method, card brand, sale amount, fees for that
   sale and net.
Do not make up data. If a row has empty fields, point it out.
Need help?
If you have questions about a specific withdrawal, contact us at support@rebill.com.